There are tones of informative reports that might reveal you a bit more about your current audience and its behavior. Putting myself in the customer’s shoes, I’ve realized that choosing, signing up, and subscribing to some analytics or A/B/N testing system is only a half of the way. The thing is – being able to actually read the data received after all and doing something about it.
So, our today’s “article guests” are reports and filters from Maxymizely (I suppose, you can apply my tips for other systems too). And now – welcome our precious analyzers: tiny checkboxes and cute buttons, they are the keys for understanding charts!
The part which happenned to be especially interesting for me in my last chart investigation was time aggregation. If you still haven’t got a chance to notice a great dependency of your conversion peaks on seasons, weeks, and time, do it now. My analysis was focused on Maxymizely blog articles and their statistics, and Maxymizely visit page that all are linked with each other.
CASE STUDY #1:

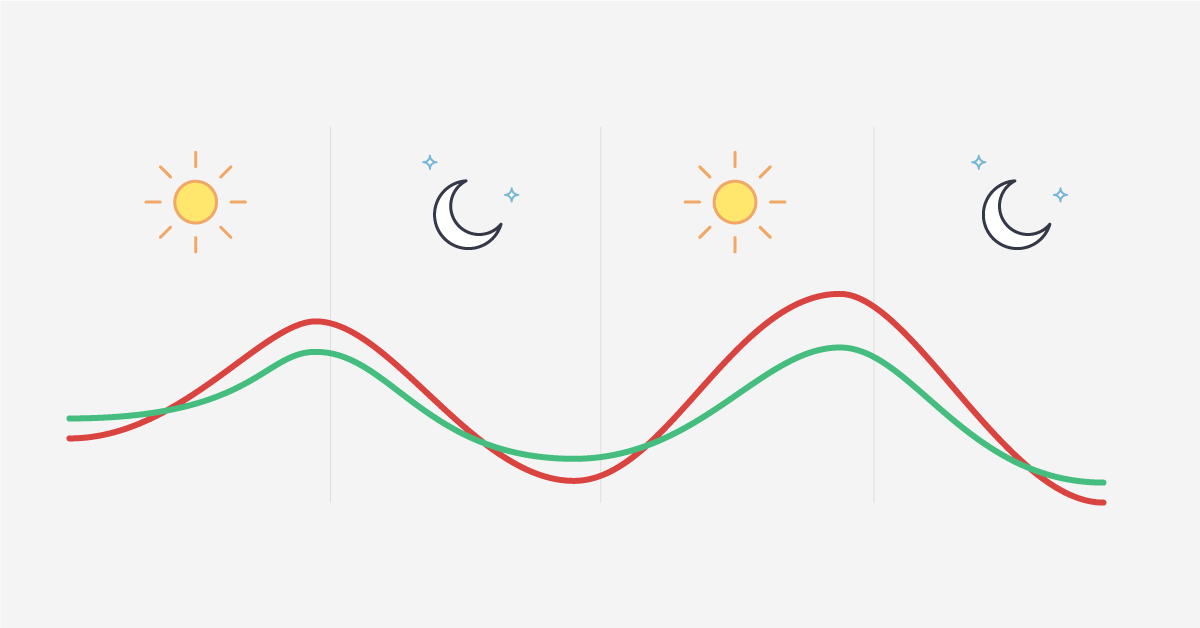
- Our blog is mostly readable on Mondays in the first part of the day.
- Other work days don’t show significate numbers and the audience is obviously more focused on working, not reading stuff.
Food for thought: We should always consider a psychological profile of our readers (customers): they start their week in a slow motion, studying stuff about analytics and experiments, then, closer to the Monday evening or Tuesday morning they switch to the work mode. We (the Maxymizely team and I) should post our most valuable posts on Mondays to continue engaging more valuable readers.
Where to find this report in Maxymizely (if you have signed up – see the step description below):
- Log in here.
- In Analytics, choose your app/web site, which behaviormental characteristics you are interested in.
- Go to the General -> New vs. Returned.
- Set the period within which you want to see changes.
- In Filters, choose the audience (I would leave All users for the start).
Some cases when such details matter:
- You purchase ads, some systems enable setting the time and days when you want to show your advertizement.
- You purchase traffic, you can pour it more specifically and save some money.
- You sell something online, you can push some sales to fill in the gaps without visitors when the business is slow.
- You want to predict the load on the server or/and order department per day/week/month/year.
In this article, I’ll demonstrate another useful report that can deliver you some facts. The bunch of Behavior reports display the hidden but one of the most desirable knowledge:
CASE STUDY #2:
For instance, I’d like to see whether my product is gaining the popularity and my new users turn into returned.

This trend proves that since the very beginning of our blog we are successfully enlarging the number of returned readers; the number of new users drops.
Where to find this report in Maxymizely:
Analytics -> Behavior -> User Lifetime Retention (Make sure the Show in percents checkbox in Filters is checked.)
CASE STUDY #3:
Say, I want to check some sequence of actions before logging in on the home page of our Maxymizely site.

What conclusions we can make is that the price doesn’t kill the desire of Maxymizely potential visitors to sign up to the system.
Where to find this report in Maxymizely:
Analytics -> Behavior -> Action Sequence Before Event
Don’t forget to choose in Filters the Target Action Type (it’s Click in my case) and Target Content (it’s Sign Up in my case).
CASE STUDY #4:
Another fact, which I’ve revealed is that Pricing Plan is acceptable by most of our English speaking audience, whereas Russian speaking users find it expensive and drop off.

Where to find this report in Maxymizely:
Analytics -> Behavior -> Actions Before Drop-off
That`s all I can share at the moment. What else would I add is that if you start understanding what’s going on on you app or website, I’d recommend this article on how to avoid conversion killers.
And remember, the results of your investigation – whether winning, losing, or inconclusive – are a valuable resource that you’ll use to feed the iterative cycle of your optimization program.
I would be truly grateful if you share your own positive or negative experience of using filters and reports in the comments below – to help others in their analytical research.

